
June 2024
Provided by Prairie Research Associates

Background and Objectives
Background
- Historically, this study has been used as a tool for measuring the level of satisfaction of the citizens of Winnipeg.
- The City of Winnipeg has conducted this study annually since 2001 (three years missed – 2005, 2006, and 2008).
Objectives
- Determine Winnipeg citizen’s levels of satisfaction regarding their city
- Determine Winnipeg citizen’s current needs in their city
- Gauge how those needs have changed and where they are heading
e.g. Are specific issues trending downward or emerging?
- Gauge how those needs have changed and where they are heading
Methodology
A total of 600 Winnipeg citizens aged 18 years and over were interviewed by telephone between May 1 to May 21, 2024. The sample include both landlines and cell phone numbers. The final results in this survey are weighted by age, gender, and income of Winnipeg respondents according to 2021 Statistics Canada census data.
The margin-of-error for this telephone survey of 600 adults is +/- 4.0%, 19 times out of 20. The margin-of-error is higher for sub-populations analyzed in these results.
Where applicable, this report compares the results of the 2024 survey with the results of previous citizen satisfaction surveys conducted in 2020 to 2023.
Notes:
- Data presented is based on people who answered the survey questions (excludes “don’t know/refused” response).
- The percentages shown in this report may not add up to exactly 100%, due to rounding.
- Values less than 3% may not be shown in charts.
Demographics
The majority of respondents are under 55 years old and about three-quarters are homeowners.
Age
Question 73 -- Which of the following age groups are you in? (Base: All respondents (excluding Refused). 2024 n=597) - unweighted
| Age | Percent |
|---|---|
| 65 and older | 25% |
| 55 to 64 | 10% |
| 45 to 54 | 22% |
| 35 to 44 | 16% |
| 25 to 34 | 21% |
| 18 to 24 | 7% |
Own/Rent Home
Question 74 -- Do you rent or own your home? (Base: All respondents (excluding Don’t know/Refused). 2024 n=586) - unweighted
| Own or Rent | Percent |
|---|---|
| Rent | 23% |
| Own | 77% |
Level of Education
The majority of respondents have some post-secondary education with 49% having a university degree. Of the 69% of residents who answered the income question, about 2 in 3 have a household income of $60,000 or more.
Question 75 -- What is the highest level of education you have completed? (Base: All respondents (excluding Don’t know/Refused). 2024 n=591) - unweighted
| Level of Education | Percent |
|---|---|
| University degree(s) | 49% |
| Community college/technical | 27% |
| Completed high school | 22% |
| Less than high school | 3% |
Household Income
Question 76 -- Total household income before taxes. (Base: All respondents (excluding Don’t know/Refused). 2024 n=411) - unweighted
| Income | Percent |
|---|---|
| $150K+ | 17% |
| $100K to $150k | 17% |
| $80K to <$100K | 15% |
| $60K to <$80K | 17% |
| $30K to <$60K | 23% |
| <$30K | 11% |
Where do they live?
Question 78 -- First three characters of postal code. (Base: All respondents (excluding Don’t know/Refused). 2024 n=594) – unweighted
| Quadrant | Percent |
|---|---|
| Downtown | 11% |
| West/Southwest | 37% |
| North | 17% |
| East/Southeast | 36% |
| Inner or outer city | Percent |
|---|---|
| Inner City | 26% |
| Outer City | 74% |

Map of Winnipeg divided by postal code areas using colours to show four quadrants: Downtown, East/Southeast, West/Southwest, and North. The map also has a dark blue line around inner city postal code areas (R2X, R2W, R3E, R3A, R3B, R3C, R3G, R2L, R2H, and R3L) and a light blue line around the other postal code areas to show the outer city.
Ethnic Origin
Groupings are similar to those used by Statistics Canada. In the report, those identified as visible minority are those who identify as having a background other than only white/Caucasian.
Question 77 -- How would you describe your ethnic background? Multiple responses allowed (Base: All respondents (excluding Don’t know/Refused). 2024 n=577) -- unweighted
| Ethnic origin | Percent |
|---|---|
| White/Caucasian (e.g., European) | 76% |
| Indigenous or Aboriginal | 9% |
| South Asian (e.g., East Indian, Pakistani) | 4% |
| Filipino | 3% |
| Black (e.g., African) | 3% |
| Southeast Asian (e.g., Vietnamese) | 3% |
| Latin American | 1% |
| Chinese | 2% |
| Arab (e.g., Saudi, Egyptian) | 1% |
| West Asian (e.g., Iranian) | <1% |
| Other | 1% |
Results
2024 Overall Satisfaction
Quality of Life (Very good/Good)
| Year | Percent |
|---|---|
| 2020 | 97% |
| 2021 | 89% |
| 2022 | 88% |
| 2023 | 84% |
| 2024 | 82% |
Value for Tax Dollars (Very good/Good)
| Year | Percent |
|---|---|
| 2020 | 78% |
| 2021 | 64% |
| 2022 | 59% |
| 2023 | 59% |
| 2024 | 55% |
Customer Service (Very /Somewhat Satisfied)
| Year | Percent |
|---|---|
| 2020 | 82% |
| 2021 | 78% |
| 2022 | 73% |
| 2023 | 72% |
| 2024 | 78% |
Overall City Services (Very /Somewhat Satisfied)
| Year | Percent |
|---|---|
| 2020 | 90% |
| 2021 | 87% |
| 2022 | 81% |
| 2023 | 80% |
| 2024 | 76% |
Net Promoter Score Value
21% are classified as Winnipeg Promoters, and the overall 2024 Net Promoter Score is -16. This is a 1-point decrease compared to 2023. It marks the third straight year of greater number of detractors than promoters.
NET Promoter Score (NPS) is calculated by subtracting the Detractor score from the Promoter score (% Promoters - % Detractors)
Question 2 -- On a scale from 0 to 10, where 0 is not at all likely and 10 is very likely, how likely would you be to recommend Winnipeg as a place to live? (Base: All respondents (excluding Don’t know/Refused). 2024 n=597)
Likelihood of Recommending Winnipeg as a Place to Live
| Year | Net Promoter Score | Promoters (9-10 out of 10) | Passives (7-8 out of 10) | Detractors (0-6 out of 10) |
|---|---|---|---|---|
| 2020 | +17 | 36% | 45% | 19% |
| 2021 | +1 | 27% | 47% | 26% |
| 2022 | -14 | 21% | 45% | 35% |
| 2023 | -15 | 21% | 43% | 36% |
| 2024 | -16 | 21% | 42% | 37% |
Quality of Life
Although 82% of Winnipeggers rate the overall quality of life in Winnipeg as very good or good, it marks the fourth consecutive decrease and the proportion who say it is very good has also decreased over that time.
Overall quality of life in Winnipeg today
Question 3 -- In general, how would you consider the overall quality of life in Winnipeg today? (Base: All respondents (excluding Don’t know/Refused). 2024 n=594)
| Year | Net very Good/Good | Very good | Good | Poor | Very poor |
|---|---|---|---|---|---|
| 2020 | 97% | 40% | 56% | 3% | 1% |
| 2021 | 89% | 23% | 66% | 9% | 1% |
| 2022 | 89% | 20% | 69% | 10% | 3% |
| 2023 | 84% | 18% | 66% | 14% | 2% |
| 2024 | 82% | 15% | 67% | 14% | 2% |
Quality of Life Statements
Q4 to Q9 -- I am now going to read you a few statements about your perception of Winnipeg. For each one, please tell me whether you strongly agree, agree, disagree, or strongly disagree. (Base: All respondents (excluding Don’t know/Refused). 2024 n=450-598
Easy to get around by car
| Year | Percent who responded Strongly agree/Agree |
|---|---|
| 2020 | 94% |
| 2021 | 91% |
| 2022 | 88% |
| 2023 | 89% |
| 2024 | 88% |
Easy to get around by walking
| Year | Percent who responded Strongly agree/Agree |
|---|---|
| 2020 | 80% |
| 2021 | 77% |
| 2022 | 72% |
| 2023 | 67% |
| 2024 | 70% |
Note
- In 2024, 82% of those who identified as 55+ years old felt it is easy to get around by walking (higher than average).
Feel safe walking alone at night in neighbourhood
| Year | Percent who responded Strongly agree/Agree |
|---|---|
| 2020 | 68% |
| 2021 | 66% |
| 2022 | 66% |
| 2023 | 60% |
| 2024 | 62% |
Note
- In 2024, 22% of those who identified as having less than a high school education and 42% of inner-city residents and 54% of women felt safe walking alone at night in their neighborhood (lower than average).
Easy to get around by bicycle
| Year | Percent who responded Strongly agree/Agree |
|---|---|
| 2020 | 64% |
| 2021 | 66% |
| 2022 | 63% |
| 2023 | 58% |
| 2024 | 61% |
Easy to get around by transit
| Year | Percent who responded Strongly agree/Agree |
|---|---|
| 2020 | 64% |
| 2021 | 62% |
| 2022 | 61% |
| 2023 | 56% |
| 2024 | 52% |
Note
In 2024, 70% of those who identified as a visible minority and 68% of those who identified as Indigenous felt was easy to get around by transit (higher than average).
Feel safe walking alone at night downtown
| Year | Percent who responded Strongly agree/Agree |
|---|---|
| 2020 | 18% |
| 2021 | 14% |
| 2022 | 14% |
| 2023 | 10% |
| 2024 | 8% |
Perceptions of Winnipeg Statements
Question 10 to Question 12 -- I am now going to read you a few statements about your perception of Winnipeg. For each one, please tell me whether you strongly agree, agree, disagree, or strongly disagree. (Base: All respondents (excluding Don’t know/Refused). 2024 n=522-579
I can find the information I need on the City of Winnipeg website
| Year | Percent who responded Strongly agree/Agree |
|---|---|
| 2024 | 81% |
| 2023 | 79% |
| 2022 | 82% |
| 2021 | 85% |
| 2020 | 88% |
I believe the City of Winnipeg acts in the best interest of citizens
| Year | Percent who responded Strongly agree/Agree |
|---|---|
| 2024 | 68% |
| 2023 | 61% |
| 2022 | 66% |
| 2021 | 71% |
| 2020 | 82% |
Believe that I can influence the decisions or direction of the City of Winnipeg
| Year | Percent who responded Strongly agree/Agree |
|---|---|
| 2024 | 40% |
| 2023 | 40% |
| 2022 | 42% |
| 2021 | 43% |
| 2020 | 52% |
Question 12A to Question 12C -- I am now going to read you a few statements about your perception of Winnipeg. For each one, please tell me whether you strongly agree, agree, disagree, or strongly disagree. (Base: All respondents (excluding Don’t know/Refused). 2024 n=520-563)
I find the City of Winnipeg to be a trustworthy source of information
| Year | Percent who responded Strongly agree/Agree |
|---|---|
| 2024 | 81% |
| 2023 | 83% |
| 2022 | 83% |
| 2021 | 87% |
I believe the City of Winnipeg's actions towards reconciliation with Indigenous peoples are making a positive impact
| Year | Percent who responded Strongly agree/Agree |
|---|---|
| 2024 | 65% |
| 2023 | 68% |
| 2022 | 71% |
| 2021 | 70% |
I believe the City of Winnipeg is doing enough for residents who are experiencing homelessness.
| Year | Percent who responded Strongly agree/Agree |
|---|---|
| 2024 | 27% |
| 2023 | 25% |
| 2022 | 24% |
Note
- In 2024, 19% of women believe the City of Winnipeg is doing enough for residents who are experiencing homelessness (lower than average).
Actions to Improve Quality of Life
Citizens most commonly mentioned roads and infrastructure for improving the quality of life in Winnipeg, followed by crime and policing. Results overall are similar to 2023.
Question 13 -- What actions do you think the City of Winnipeg could take to improve the quality of life in the City? (accept up to 3 answers) (Base: All respondents (excluding Don’t know/Refused). 2024 n=530)
| Action to improve quality of life | 2024 | 2023 | 2022 | 2021 | 2020 |
|---|---|---|---|---|---|
| Roads / Infrastructure | 39% | 36% | 58% | 23% | 29% |
| Crime / Policing | 36% | 33% | 14% | 23% | 24% |
| Housing / Social programs | 31% | 30% | 23% | 24% | 15% |
| Improve services | 18% | 19% | 23% | 22% | 26% |
| Active living / Transit | 15% | 17% | 17% | 20% | 21% |
| Economy | 8% | 12% | 11% | 8% | 11% |
| City Planning | 11% | 11% | 8% | 10% | 10% |
| All Others | 15% | 18% | 18% | 22% | 17% |
| Nothing | <1% | <1% | 1% | 2% | 4% |
Top Actions by perceived Quality of Life
Question 13 -- What actions do you think the City of Winnipeg could take to improve the quality of life in the City? (accept up to 3 answers) (Base: All respondents (excluding Don’t know/Refused). 2024 n=530)
| Action | Very good/Good (84%, n=496) | Very Poor/Poor (16%, n=95) |
|---|---|---|
| Roads / Infrastructure | 40% | 37% |
| Housing/social programs | 30% | 35% |
| Improve services | 18% | 18% |
| Active living / Transit | 15% | 18% |
| Crime / Policing | 35% | 41% |
| Economy | 8% | 11% |
| City Planning | 10% | 12% |
Most common actions for Good/Very good (81%, n=419)
- Fix roads and streets (34%)
- Reduce crime (23%)
- Address homelessness (19%)
- Improve public transit (9%)
- Develop affordable housing (9%)
Most common actions for Very poor/Poor (19%, n=105)
- Reduce crime (35%)
- Fix road and streets (28%)
- Address homelessness (23%)
- Fix the City’s infrastructure (12%)
- Improve public transit (12%)
Selected verbatims for Good/Very good (81%)
- “Fix the potholes. Renew the downtown for all citizens to be safe -- for example, add festivals in the area.”
- “Improving downtown.”
- “Infrastructures are the worst, too many people getting building permits that have no right to be approved.”
- “More police officers and improve the roads.”
- “Reduce crime. Fix the condition of the streets.”
- “Road repair.”
- “Too many stabbings, and when they catch the guys, they let them out right away.”
Selected verbatims for Very poor/Poor (19%)
- “Address homelessness and addiction. Improve the transit system.”
- “Better policing. Harsher consequences for criminals. Make it easier for those on a bicycle.”
- “Make it feel safer. I feel scared to walk around. Fix roads, lots of potholes.”
- “Revive downtown. Fix our roads and bridges. Better health care. Bring back more emergency hospitals. We are taxed to death, bring that down.”
- “Roads need to be improved. Safety of Transit. Clean up Main Street by supporting the homeless population.”
Value for Tax Dollars
Over half of Winnipeggers feel that they receive good or very good value for their property tax dollars; however, this proportion has dropped to the lowest over the past five years.
Question 14 -- Considering the services provided by the City for your property tax dollars, do you feel you receive… (Base: All respondents (excluding Don’t know/Refused). 2024 n=546)
| Year | Percent who answered Very good/ Good value | Very good value | Good value | Poor value | Very poor value |
|---|---|---|---|---|---|
| 2020 | 78% | 8% | 70% | 19% | 3% |
| 2021 | 64% | 7% | 58% | 28% | 8% |
| 2022 | 59% | 4% | 55% | 33% | 8% |
| 2023 | 59% | 4% | 55% | 31% | 10% |
| 2024 | 55% | 3% | 52% | 36% | 9% |
Note
- There are no demographic subgroups more likely to rate value for tax dollars as very good or good.
Question 14B -- Why do you feel you receive good/poor value* from your property tax dollars? Multiple response allowed. (Base: Gave an opinion about value for taxes (excluding Don’t know/Refused). 2024 n=400)
*Question text responsive to respondent's previous answer.
| Reason | Very good/good value (55%, n=201) | Very poor/poor value (45%, n199) |
|---|---|---|
| City Planning/Spending | 57% | 35% |
| Services | 39% | 30% |
| Roads/Infrastructure | 15% | 49% |
| Safety/Policing | 7% | 9% |
| Other | 15% | 20% |
Most common reasons for very good/good value (55%, n=201)
- General satisfaction with the City (44%)
- Satisfaction with garbage/recycling (18%)
- Satisfaction with snow clearing (16%)
- Satisfaction with street cleaning (12%)
Most common reasons for very poor/poor value (45%, n=199)
- Dissatisfaction with roads (45%)
- Dissatisfaction with the City’s spending (18%)
- Dissatisfaction with services/workers (12%)
- Dissatisfaction with City administration (11%)
- High taxes (10%)
Selected verbatims for very good/good value (55%)
- “Area I live in is very good.”
- “Garbage and recycling is picked up regularly. I had to call 911 for a fire in the last year - firefighters came quite quickly. Easy to find parking in neighbourhood.”
- “Garbage pickup and they try to fix the roads.”
- “Getting good basic services - garbage collection, snow removal.”
- “Given the infrastructure in the neighborhood, I think it is an improvement.”
- “I think they keep the road in half reasonable conditions considering our winters.”
- “I'm in an apartment and I'm happy with the rent that I pay.”
- “Road and snow cleaning/clearing. Garbage pickup.”
- “The services we get such as snow clearing, sidewalk cleaning are good services.”
- “We pay a lot for our taxes but I think we have very good city services, unfortunately you have to pay to get good services.”
Selected verbatims for very poor/poor value (45%)
- “Everything (buildings, roads) is deteriorating.”
- “How the money is spent, the perception is that it's being wasted.”
- “I get taxed so much, yet nothing gets improved, basic stuff like road conditions, accessibility for disabled, and adding stupid bike lanes everywhere, it’s a waste of money.”
- “Lack of services.”
- “Most areas of the city aren't safe and roads are awful.”
- “Potholes, taxes are high, and less services.”
- “Streets are bad, schools keep getting programs cut.”
- “The schools are introducing pornography in their education which I do not approve.”
- “The services are coming down - snow clearing is getting poorer and spring cleaning the streets is not happening now.”
- “We have crumbling roads. Arlington Bridge shut down. Too much spending on policing.”
Customer Service
Contact with the City
Slightly over half of Winnipeggers contacted the city in the past year, with homeowners and those with post-secondary education being more likely to do so. Phone is the most common method used to contact the City followed by email; however, there is continued growth in completing an online form.
Q65 -- Have you contacted 311 or another staff member from the City of Winnipeg in the last year? (Base: All respondents (excluding Don’t know/Refused). 2024 n=594)
Contact with the City in the last year
| Year | Percent who responded Strongly agree/Agree |
|---|---|
| 2024 | 54% |
| 2023 | 60% |
| 2022 | 58% |
| 2021 | 55% |
| 2020 | 63% |
Notes
- In 2024, 59% of those who own a home had contacted the City in the last year (higher than average).
- In 2024, 39% of those with a high school education or less had contacted the City in the last year (lower than average).
Question 66 -- How did you contact the City of Winnipeg? Multiple responses allowed (Base: Contacted the city (excluding Don’t know/Refused). 2024 n=319)
| Year | Percentage who contacted the City by phone |
|---|---|
| 2024 | 83% |
| 2023 | 84% |
| 2022 | 82% |
| 2021 | 85% |
| 2020 | 87% |
| Year | Percentage who contacted the City by email |
|---|---|
| 2024 | 21% |
| 2023 | 22% |
| 2022 | 18% |
| 2021 | 17% |
| 2020 | 14% |
| Year | Percentage who contacted the City by completing the form online |
|---|---|
| 2024 | 16% |
| 2023 | 15% |
| 2022 | 12% |
| 2021 | 7% |
| 2020 | 9% |
| Year | Percentage who contacted the City in person |
|---|---|
| 2024 | 4% |
| 2023 | 3% |
| 2022 | 4% |
| 2021 | 2% |
| 2020 | 2% |
| Year | Percentage who contacted the City through social media |
|---|---|
| 2024 | 2% |
| 2023 | 3% |
| 2022 | 3% |
| 2021 | 4% |
| 2020 | 3% |
| Year | Percentage who contacted the City by mail |
|---|---|
| 2024 | 4% |
| 2023 | 2% |
| 2022 | 1% |
| 2021 | 1% |
| 2020 | 1% |
Satisfaction with Customer Service
Satisfaction with customer service remains high, increasing by six points from last year. Satisfaction with service is highest for those who contact the City by phone.
Question 67 -- How would you rate the experience? (Base: Contacted the city (excluding Don’t know/Refused). 2024 n=317)
| Year | Percent who answered Very/somewhat satisfied | Very satisfied | Somewhat satisfied | Somewhat dissatisfied | Very dissatisfied |
|---|---|---|---|---|---|
| 2020 | 82% | 46% | 37% | 10% | 7% |
| 2021 | 78% | 44% | 34% | 13% | 9% |
| 2022 | 73% | 35% | 38% | 15% | 12% |
| 2023 | 72% | 33% | 39% | 11% | 17% |
| 2024 | 78% | 40% | 39% | 10% | 12% |
There are no demographic subgroups more likely to be satisfied with the customer service experience.
| Method of contact | Percentage of Very/ Somewhat satisfied |
|---|---|
| Phone | 78% |
| 74% | |
| Online | 70% |
Customer Service Details
Question 68 to Question 71 -- I am going to read you a number of statements about the City. Thinking about your personal dealings with the City of Winnipeg and your general impressions, please tell me whether you strongly agree, somewhat agree, somewhat disagree, or strongly disagree. (Base: Contacted the city (excluding Don’t know/Refused). 2024 n=314-316)
| City staff are courteous, helpful and knowledgeable | Percent who responded Strongly/somewhat agree |
|---|---|
| 2024 | 87% |
| 2023 | 87% |
| 2022 | 90% |
| 2021 | 92% |
| 2020 | 94% |
| The quality of service from the City is consistently high | Percent who responded Strongly/somewhat agree |
|---|---|
| 2024 | 68% |
| 2023 | 66% |
| 2022 | 66% |
| 2021 | 76% |
| 2020 | 78% |
| The City responds quickly to requests and concerns | Percent who responded Strongly/somewhat agree |
|---|---|
| 2024 | 54% |
| 2023 | 53% |
| 2022 | 51% |
| 2021 | 67% |
| 2020 | 65% |
| City staff are easy to get a hold of when I need them | Percent who responded Strongly/somewhat agree |
|---|---|
| 2024 | 50% |
| 2023 | 52% |
| 2022 | 49% |
| 2021 | 61% |
| 2020 | 59% |
Note
There are no demographic subgroups more likely strongly or somewhat agree with these customer service details.
Improvement to Customer Service
Question 72 -- How could the City's customer service be improved? Multiple responses allowed (Base: Contacted customer service (excluding Don’t know/Refused). 2024 n=298)
Customers service improvements by satisfaction level
| Suggested Improvement | Very/Somewhat satisfied (78%, n=232) | Very/Somewhat dissatisfied (22%, n=66) |
|---|---|---|
| Staffing Levels/Availability | 34% | 34% |
| Staff contact | 24% | 55% |
| Systems | 8% | 20% |
| Other | 5% | 5% |
| No suggestions/satisfied | 37% | 11% |
Most common improvements for Very/Somewhat satisfied (78%, n=232)
- No suggestions/satisfied (37%)
- Answer phone more quickly/less time on hold (16%)
- More people on staff (15%)
- Staff should respond to issues quicker (9%)
Most common improvements for Very/Somewhat dissatisfied (22%, n=66)
- Answer phone more quickly/less time on hold (19%)
- More people on staff/phones (14%)
- Less automation (14%)
- Staff should respond to issues quicker (12%)
- Staff should be more knowledgeable (12%)
Selected verbatims for Very/Somewhat satisfied (78%)
- “Additional staff for inbound response. Additional workforce for seasonality.”
- “Faster and make call backs.”
- “Hire more staff for the city.”
- “Leverage online ways to contact, modernize.”
- “More staff to answer in a timely manner.”
- “Shorter wait times when you call 311.”
- “They need to improve inner employee relationship.”
Selected verbatims for Very/Somewhat dissatisfied (22%)
- “311 system if you call it, they just redirect you to email. So, more live people needed.”
- “Hire more people. Educate them more so operators know what department to put you through immediately.”
- “Hiring more staff to avoid long wait times.”
- “More people to respond quickly.”
- “More staff faster response time.”
- “Shorter wait times. More staff.”
- “The main problem is system itself.”
City Services
Overall Satisfaction with City Services
76% of Winnipeggers are at least somewhat satisfied with city services, which dropped for the third consecutive survey.
Question 52 -- In general, how satisfied are you overall with the services provided by the City of Winnipeg? (Base: All respondents (excluding Don’t know/Refused). 2024 n=597)
| Year | Net very/ somewhat satisfied | Very satisfied | Somewhat satisfied | Somewhat dissatisfied | Very dissatisfied |
|---|---|---|---|---|---|
| 2020 | 88% | 27% | 62% | 9% | 2% |
| 2021 | 90% | 23% | 64% | 10% | 3% |
| 2022 | 87% | 13% | 68% | 16% | 3% |
| 2023 | 80% | 12% | 68% | 16% | 4% |
| 2024 | 76% | 11% | 64% | 20% | 4% |
Note
- There are no demographic subgroups more likely to be satisfied with the overall satisfaction with city services.
Importance of Service Areas
Amongst four areas, Winnipeggers rank public safety as the most important service area followed by infrastructure.
Question 53 -- Rank the following group of services in order of importance where 1 is the most important to you and 4 is the least important to you. (Base: All respondents (excluding Don’t know/Refused). 2024 n=569-579)
| Service Area | Importance (weighted) | % Ranked 1 and 2 | Ranking 2024 comparison to 2023 |
|---|---|---|---|
| Public Safety (Fire Paramedic, Police) | 1.7 | 83% | Decreased since last year |
| Infrastructure (Roads, Water) | 2.3 | 65% | Increased since last year |
| Community Services (Libraries, Recreation) | 2.8 | 35% | Decreased since last year |
| Property & Development (Land use planning) | 3.2 | 20% | Increased since last year |
Ratings of importance have fluctuated somewhat from year to year, although public safety has always remained as the highest ranked priority.
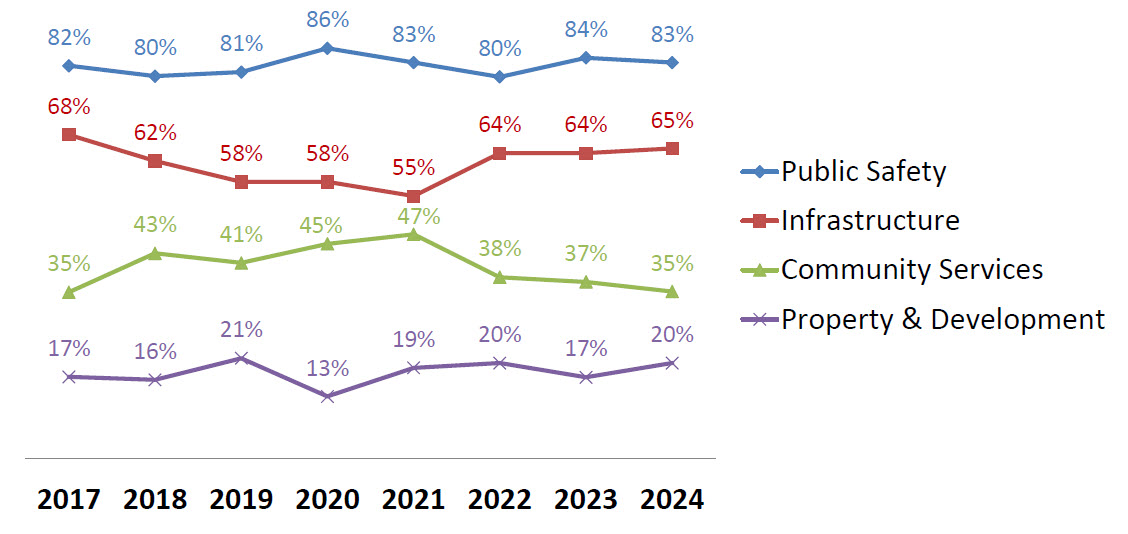
Chart showing how four service areas have changed in ranking since 2017. Throughout this time, public safety has remained as the top priority, infrastructure has remained as the second priority, community services has remained the third priority, and property and development has remained the fourth priority. From 2019 to 2021, community services rose and infrastructure dropped so they were nearly equally ranked in 2021. This trend reversed in the time period from 2022 to 2024, where infrastructure rose to 65% while community services decreased to 35%.
Satisfaction with Public Works
Question 15/Question 21/Question 22/Question 23/Question 27/Question 36/Question 41/Question 42 -- Now, I'm going to read you a list of services that are provided by the City of Winnipeg. Please tell me whether you are very dissatisfied, somewhat dissatisfied, somewhat satisfied or very satisfied with each of the following services. ((excluding Don’t know/Refused). 2024 n=461-598)
Condition of major parks (among those who used it)
| Year | Percent who responded very satisfied/somewhat satisfied |
|---|---|
| 2020 | 97% |
| 2021 | 90% |
| 2022 | 90% |
| 2023 | 88% |
| 2024 | 89% |
Insect control
| Year | Percent who responded very satisfied/somewhat satisfied |
|---|---|
| 2020 | 87% |
| 2021 | 86% |
| 2022 | 84% |
| 2023 | 81% |
| 2024 | 84% |
Condition of the local park in your neighbourhood (among those who used it)
| Year | Percent who responded very satisfied/somewhat satisfied |
|---|---|
| 2020 | 92% |
| 2021 | 82% |
| 2022 | 79% |
| 2023 | 80% |
| 2024 | 80% |
Snow removal
| Year | Percent who responded very satisfied/somewhat satisfied |
|---|---|
| 2020 | 77% |
| 2021 | 75% |
| 2022 | 63% |
| 2023 | 66% |
| 2024 | 71% |
Management of rush hour traffic flow
| Year | Percent who responded very satisfied/somewhat satisfied |
|---|---|
| 2020 | 60% |
| 2021 | 62% |
| 2022 | 56% |
| 2023 | 54% |
| 2024 | 53% |
City’s efforts to keep city clean and beautiful
| Year | Percent who responded very satisfied/somewhat satisfied |
|---|---|
| 2020 | 73% |
| 2021 | 65% |
| 2022 | 55% |
| 2023 | 58% |
| 2024 | 59% |
Condition of major streets
| Year | Percent who responded very satisfied/somewhat satisfied |
|---|---|
| 2020 | 58% |
| 2021 | 61% |
| 2022 | 41% |
| 2023 | 44% |
| 2024 | 45% |
Condition of residential streets in your neighbourhood
| Year | Percent who responded very satisfied/somewhat satisfied |
|---|---|
| 2020 | 54% |
| 2021 | 51% |
| 2022 | 39% |
| 2023 | 47% |
| 2024 | 45% |
Note
- In 2024, 62% of those who identified as a visible minority were satisfied with the condition of residential streets (higher than average).
Satisfaction with Community Services
Question 35/Question 37/Question 38/Question 39/Question 40/Question 49/Question 51 -- Now, I'm going to read you a list of services that are provided by the City of Winnipeg. Please tell me whether you are very dissatisfied, somewhat dissatisfied, somewhat satisfied or very satisfied with each of the following services. ((excluding Don’t know/Refused). 2024 n=191-556)
Public Library Services (among those who used it)
| Year | Percent who responded very satisfied/somewhat satisfied |
|---|---|
| 2020 | 91% |
| 2021 | 93% |
| 2022 | 85% |
| 2023 | 84% |
| 2024 | 83% |
Support for arts, entertainment & culture
| Year | Percent who responded very satisfied/somewhat satisfied |
|---|---|
| 2020 | 85% |
| 2021 | 82% |
| 2022 | 82% |
| 2023 | 83% |
| 2024 | 82% |
Community Centre operated programs (among those who used it)
| Year | Percent who responded very satisfied/somewhat satisfied |
|---|---|
| 2020 | 94% |
| 2021 | 89% |
| 2022 | 89% |
| 2023 | 81% |
| 2024 | 78% |
Condition of City of Winnipeg Community Centres (among those who used it)
| Year | Percent who responded very satisfied/somewhat satisfied |
|---|---|
| 2020 | 85% |
| 2021 | 75% |
| 2022 | 79% |
| 2023 | 75% |
| 2024 | 74% |
Condition of City-operated recreation facilities (among those who used it)
| Year | Percent who responded very satisfied/somewhat satisfied |
|---|---|
| 2020 | 85% |
| 2021 | 75% |
| 2022 | 76% |
| 2023 | 70% |
| 2024 | 71% |
Efforts to ensure that residential property standards are met through inspections
| Year | Percent who responded very satisfied/somewhat satisfied |
|---|---|
| 2020 | 70% |
| 2021 | 72% |
| 2022 | 66% |
| 2023 | 68% |
| 2024 | 70% |
City-operated recreation programs (among those who used it)
| Year | Percent who responded very satisfied/somewhat satisfied |
|---|---|
| 2020 | 87% |
| 2021 | 83% |
| 2022 | 86% |
| 2023 | 67% |
| 2024 | 69% |
Note
- There are no demographic subgroups more likely to be satisfied with community services.
Satisfaction with Police Service
Question 24/ Question 25/ Question 46 -- Now, I'm going to read you a list of services that are provided by the City of Winnipeg. Please tell me whether you are very dissatisfied, somewhat dissatisfied, somewhat satisfied or very satisfied with each of the following services. (excluding Don’t know/Refused). 2024 n=137-569)
Enforcement of traffic laws
| Year | Percent who responded very satisfied/somewhat satisfied |
|---|---|
| 2020 | 72% |
| 2021 | 71% |
| 2022 | 68% |
| 2023 | 68% |
| 2024 | 66% |
Police Service response to 911 calls (among those who used it)
| Year | Percent who responded very satisfied/somewhat satisfied |
|---|---|
| 2020 | 78% |
| 2021 | 69% |
| 2022 | 63% |
| 2023 | 60% |
| 2024 | 60% |
Police service efforts in crime prevention
| Year | Percent who responded very satisfied/somewhat satisfied |
|---|---|
| 2020 | 74% |
| 2021 | 70% |
| 2022 | 70% |
| 2023 | 58% |
| 2024 | 60% |
Note
- There are no demographic subgroups more likely to be satisfied with community services.
Satisfaction with Fire Paramedic Services
Question 17/ Question 28/ Question 44/ Question 47/ Question 48 -- Now, I'm going to read you a list of services that are provided by the City of Winnipeg. Please tell me whether you are very dissatisfied, somewhat dissatisfied, somewhat satisfied or very satisfied with each of the following services. (excluding Don’t know/Refused). 2024 n=179-517)
Fire and rescue service response to fire emergencies
| Year | Percent who responded very satisfied/somewhat satisfied |
|---|---|
| 2020 | 97% |
| 2021 | 93% |
| 2022 | 88% |
| 2023 | 88% |
| 2024 | 88% |
Fire and injury prevention education
| Year | Percent who responded very satisfied/somewhat satisfied |
|---|---|
| 2020 | 89% |
| 2021 | 85% |
| 2022 | 79% |
| 2023 | 82% |
| 2024 | 82% |
Level of city preparedness, ability to respond, and assist during natural and human caused disasters
| Year | Percent who responded very satisfied/somewhat satisfied |
|---|---|
| 2020 | 90% |
| 2021 | 81% |
| 2022 | 74% |
| 2023 | 79% |
| 2024 | 77% |
Safety of existing buildings through fire inspections and enforcement
| Year | Percent who responded very satisfied/somewhat satisfied |
|---|---|
| 2020 | 89% |
| 2021 | 85% |
| 2022 | 81% |
| 2023 | 75% |
| 2024 | 72% |
Note
- In 2024, 61% of those 55+ years old indicated they were satisfied with the Safety of existing buildings through fire inspections and enforcement (lower than average).
Emergency response capability for medical emergencies
| Year | Percent who responded very satisfied/somewhat satisfied |
|---|---|
| 2020 | 87% |
| 2021 | 84% |
| 2022 | 74% |
| 2023 | 70% |
| 2024 | 69% |
Satisfaction with Planning, Property & Development
Question 16/ Question 18/ Question 19/ Question 20/ Question 29/ Question 45 -- Now, I'm going to read you a list of services that are provided by the City of Winnipeg. Please tell me whether you are very dissatisfied, somewhat dissatisfied, somewhat satisfied or very satisfied with each of the following services. (excluding Don’t know/Refused). 2024 n=441-529)
Efforts in preserving heritage buildings
| Year | Percent who responded very satisfied/somewhat satisfied |
|---|---|
| 2020 | 84% |
| 2021 | 81% |
| 2022 | 77% |
| 2023 | 76% |
| 2024 | 75% |
Efforts in promoting economic development
| Year | Percent who responded very satisfied/somewhat satisfied |
|---|---|
| 2020 | 77% |
| 2021 | 72% |
| 2022 | 67% |
| 2023 | 67% |
| 2024 | 67% |
Community planning to guide growth and change
| Year | Percent who responded very satisfied/somewhat satisfied |
|---|---|
| 2020 | 66% |
| 2021 | 66% |
| 2022 | 64% |
| 2023 | 62% |
| 2024 | 64% |
Zoning regulations and building permits
| Year | Percent who responded very satisfied/somewhat satisfied |
|---|---|
| 2020 | 66% |
| 2021 | 62% |
| 2022 | 60% |
| 2023 | 62% |
| 2024 | 60% |
Funding for improving inner city housing
| Year | Percent who responded very satisfied/somewhat satisfied |
|---|---|
| 2020 | 60% |
| 2021 | 53% |
| 2022 | 49% |
| 2023 | 49% |
| 2024 | 52% |
Downtown renewal
| Year | Percent who responded very satisfied/somewhat satisfied |
|---|---|
| 2020 | 68% |
| 2021 | 59% |
| 2022 | 54% |
| 2023 | 47% |
| 2024 | 48% |
Note
- There are no demographic subgroups more likely to be satisfied with planning, property and development services.
Satisfaction with Water and Waste
Question 30 to Question 34 -- Now, I'm going to read you a list of services that are provided by the City of Winnipeg. Please tell me whether you are very dissatisfied, somewhat dissatisfied, somewhat satisfied or very satisfied with each of the following services. (excluding Don’t know/Refused). 2024 n=495-594)
Protection from river flooding
| Year | Percent who responded very satisfied/somewhat satisfied |
|---|---|
| 2020 | 93% |
| 2021 | 90% |
| 2022 | 80% |
| 2023 | 89% |
| 2024 | 84% |
Garbage collection
| Year | Percent who responded very satisfied/somewhat satisfied |
|---|---|
| 2020 | 94% |
| 2021 | 90% |
| 2022 | 84% |
| 2023 | 87% |
| 2024 | 84% |
The Recycling Program
| Year | Percent who responded very satisfied/somewhat satisfied |
|---|---|
| 2020 | 88% |
| 2021 | 84% |
| 2022 | 78% |
| 2023 | 82% |
| 2024 | 80% |
Protection from sewer back-up
| Year | Percent who responded very satisfied/somewhat satisfied |
|---|---|
| 2020 | 88% |
| 2021 | 86% |
| 2022 | 76% |
| 2023 | 82% |
| 2024 | 78% |
Note
- In 2024, 32% of those earning less than $30,0000 program were very dissatisfied with protection from sewer back-up (lower than average).
Quality of the drinking water
| Year | Percent who responded very satisfied/somewhat satisfied |
|---|---|
| 2020 | 86% |
| 2021 | 84% |
| 2022 | 81% |
| 2023 | 81% |
| 2024 | 81% |
Satisfaction with Transit / SOAs
Question 26/Question 43/Question 50 -- Now, I'm going to read you a list of services that are provided by the City of Winnipeg. Please tell me whether you are very dissatisfied, somewhat dissatisfied, somewhat satisfied or very satisfied with each of the following services. (excluding Don’t know/Refused). 2024 n=134-566)
Animal services
| Year | Percent who responded very satisfied/somewhat satisfied |
|---|---|
| 2020 | 91% |
| 2021 | 85% |
| 2022 | 84% |
| 2023 | 81% |
| 2024 | 80% |
Availability and convenience of on-street parking
| Year | Percent who responded very satisfied/somewhat satisfied |
|---|---|
| 2020 | 58% |
| 2021 | 66% |
| 2022 | 56% |
| 2023 | 59% |
| 2024 | 70% |
Public transit (among those who used it)
| Year | Percent who responded very satisfied/somewhat satisfied |
|---|---|
| 2020 | 59% |
| 2021 | 69% |
| 2022 | 68% |
| 2023 | 55% |
| 2024 | 55% |
Note
- There are no demographic subgroups more likely to be satisfied with transit / SOAs.
Use of City Services
Visited a local neighbourhood park
Question 58 -- Have you visited your local neighbourhood park in the past year? (excluding Don’t know/Refused). 2024 n=596)
| Year | Percent who used in the past year |
|---|---|
| 2020 | 83% |
| 2021 | 83% |
| 2022 | 83% |
| 2023 | 87% |
| 2024 | 84% |
Notes
- In 2024, 88% of those who live in the outer-city visited a local neighbourhood park (higher than average).
- In 2024, 76% of those 55+ years old, 64% of those making $30,000 per year, and 56% of those with a high school education or less visited a local neighbourhood park (lower than average).
Visited a major park
Question 59 -- Have you visited a major park like Kildonan Park or St. Vital Park in the past year? (excluding Don’t know/Refused). 2024 n=599)
| Year | Percent who responded very satisfied/somewhat satisfied |
|---|---|
| 2020 | 76% |
| 2021 | 71% |
| 2022 | 79% |
| 2023 | 79% |
| 2024 | 79% |
Note
- In 2024, 46% of those with a high school education or less visited a major park (lower than average).
Used the services of the City's public libraries
Question 64 -- Have you or someone in your family used the services of the City's public libraries in the past year? (excluding Don’t know/Refused). 2024 n=595)
| Year | Percent who responded very satisfied/somewhat satisfied |
|---|---|
| 2020 | 67% |
| 2021 | 52% |
| 2022 | 54% |
| 2023 | 57% |
| 2024 | 58% |
Note
- In 2024, 38% of those who live in north Winnipeg and 29% of those with a high school education or less used the services of the City’s public libraries (lower than average).
Attended a local Community Centre Facility
Question 55 -- Have you attended your local Community Centre Facility in the past year? (excluding Don’t know/Refused). 2024 n=595)
| Year | Percent who responded very satisfied/somewhat satisfied |
|---|---|
| 2020 | 54% |
| 2021 | 28% |
| 2022 | 36% |
| 2023 | 49% |
| 2024 | 51% |
Notes
- In 2024, 64% of those 35 to 54 years old attended a local Community Centre Facility (higher than average).
- In 2024, 31% of those making less than $30,000 per year and 24% of those with a high school education or less attended a local Community Centre Facility (lower than average).
Visited a City Recreational Facility
Question 54 -- Have you visited a City Recreational Facility like a pool or leisure centre in the past year? (excluding Don’t know/Refused). 2024 n=594)
| Year | Percent who responded very satisfied/somewhat satisfied |
|---|---|
| 2020 | 54% |
| 2021 | 27% |
| 2022 | 34% |
| 2023 | 48% |
| 2024 | 51% |
Notes
- In 2024, 63% of those with a university degree visited a City recreational facility (higher than average).
- In 2024, 26% of those making less than $30,000 per year visited a City recreational facility (lower than average).
Participated in a City Recreational Program
Question 56 -- Have you or someone in your family participated in a City Recreational Program like swimming lessons, Learn to Skate or other Leisure Guide Programs in the past year? (excluding Don’t know/Refused). 2024 n=593)
| Year | Percent who responded very satisfied/somewhat satisfied |
|---|---|
| 2020 | 42% |
| 2021 | 24% |
| 2022 | 27% |
| 2023 | 34% |
| 2024 | 40% |
Participated in a Community Centre Program
Question 57 -- Have you or your family participated in a Community Centre Program like hockey or soccer in the past year? (excluding Don’t know/Refused). 2024 n=592
| Year | Percent who responded very satisfied/somewhat satisfied |
|---|---|
| 2020 | 29% |
| 2021 | 23% |
| 2022 | 23% |
| 2023 | 31% |
| 2024 | 36% |
Note
- In 2024, 62% of those who make $150,000 or more per year participated in a Community Centre Program (higher than average).
Been involved in an emergency medical incident
Question 61 -- In the past year, have you or a family member been involved in an emergency medical incident where paramedics were requested? (excluding Don’t know/Refused). 2024 n=596
| Year | Percent who responded very satisfied/somewhat satisfied |
|---|---|
| 2020 | 27% |
| 2021 | 24% |
| 2022 | 26% |
| 2023 | 26% |
| 2024 | 31% |
Regularly use City Transit
Question 60 -- Do you regularly use the City Transit (e.g. seasonally or at least once a week)? (excluding Don’t know/Refused). 2024 n=590
| Year | Percent who responded very satisfied/somewhat satisfied |
|---|---|
| 2020 | 29% |
| 2021 | 21% |
| 2022 | 20% |
| 2023 | 23% |
| 2024 | 24% |
Notes
- In 2024, 51% of those who make less than $30,000 per year and 37% of those 18 to 35 years old and 35% of those who live in the inner-city regularly use City transit (higher than average).
- In 2024, 17% of those who identify as Caucasian regularly use City transit (lower than average).
Been involved in an incident where a 911 call of police response was needed
Question 62 -- In the past year, have you personally used, or been involved in an incident where a 911 call for police response was needed? (excluding Don’t know/Refused). 2024 n=596
| Year | Percent who responded very satisfied/somewhat satisfied |
|---|---|
| 2020 | 21% |
| 2021 | 18% |
| 2022 | 20% |
| 2023 | 23% |
| 2024 | 24% |
Applied for a building permit
Question 63 -- Have you applied for a building permit in the past year? (excluding Don’t know/Refused). 2024 n=595
| Year | Percent who responded very satisfied/somewhat satisfied |
|---|---|
| 2020 | 4% |
| 2021 | 6% |
| 2022 | 8% |
| 2023 | 8% |
| 2024 | 6% |
Key Findings
Quality of Life Indicators
- The majority of Winnipeggers (82%) rate the overall quality of life in the City as very good or good. This has dropped for the fourth consecutive year, down from a high of 97% in 2020.
- Over the past five years, there has been a consistent decline in ratings of ease of getting around by transit (down 12 points over last five years) and feeling safe walking alone at night downtown (down 10 points over last five years).
- The most common actions cited to improve the quality of life in Winnipeg are related to roads/infrastructure (39%), followed by crime and policing (36%) and housing/social programs (31%). There was very little change in these suggestions from 2023.
Net Promoter Score
- Around 1 in 5 citizens (21%) are promoters of the City of Winnipeg, but the overall 2024 Net Promoter Score sits at -16, which is similar to 2023 (-15) and 2022 (-14).
Value for Tax Dollars
- 55% of citizens feel that they receive good or very good value for their property tax dollars. This is the lowest proportion in the past five years and down from 59% last year.
- The most common reasons for finding good value for property tax dollars are general satisfaction with the city (44%), satisfaction with garbage and recycling (18%) and satisfaction with snow clearing (16%).
- The most common reasons finding poor value for property tax dollars are dissatisfaction with roads (45%) and dissatisfaction with city spending (18%).
Customer Service
- 54% of Winnipeggers contacted the City in the past year, which is the lowest in the past five years. Citizens most commonly contacted the City by phone (83%), although completing an online form (16%) has continued to grow over the past five years.
- Satisfaction with customer service is somewhat high at 78% and up from 72% last year. Satisfaction is similar whether contact is by phone (78%), email (74%), or online (70%).
- Amongst four aspects of customer service, ratings are highest for City staff being courteous, helpful and knowledgeable (87%). Two of the four ratings are up from last year, although just 1 to 2 percentage points.
City Services
- Overall satisfaction with city services is 76%, down from 80% last year and the lowest in the last five years.
- Public Safety remains the most important service area among four tested, ahead of infrastructure (which has historically ranked second).
- Satisfaction with city services remains high for the majority of services. Although a few decreased from 2023, two decreased by more than three percentage points.
- Protection from river flooding (83% - down 6%)
- Protection from sewer back-up (78% - down 4%)
- Conversely, a few services increased by more than three percentage points:
- Snow removal (71% - up 5%)
- Availability and convenience of on-street parking (70% - up 11%)
- Individual city services that received under 50% satisfaction ratings:
- Downtown renewal (48% - up 1%)
- Condition of residential streets in your neighbourhood (45% - down 2%)
- Condition of major streets (45% - up 1%)